Blog Franchise Growth · The Franchise Growth Playbook · Part 2
Pick the next site with your own comparable locations, not a demographic profile
Your open locations are the best forecast you own for the next one. Here is a franchisor's playbook for building a comparable set, matching a new address against it, and saying honestly how sure you are.

Every franchise development team eventually gets the same question from the board: if we open here, what will it do? The usual answer is a demographic profile. Median income, median age, households within three miles, and a sentence that says the neighborhood "looks like" your best locations.
That answer feels rigorous and rarely is. The better answer is sitting in your own system already. You have locations that opened in markets of every shape: dense and sparse, crowded and quiet, high income and modest. The ones whose markets most resemble the proposed site are a forecast you can trace, defend and check later.
This playbook is how to build that forecast without buying a model, and how to report it so nobody mistakes a guess for a number.
Source: Audience, About, read October 10, 2026
Why the demographic profile fails the board
We tested the profile before we built anything on it. Across 865 ZIP codes and about $102,000 of real ad spend, demographics did not predict what a lead cost. We wrote up that test in Demographics did not predict cost per lead, so we will not repeat it here. The point for a franchisor is narrower.
A demographic forecast cannot be audited. When the new location underperforms, nobody can say which assumption was wrong, because the number never came from a real business. A comparable-location forecast can be audited on day one and again at month six: here are the four locations we said this site would resemble, here is what they did, here is what the new one did. If it missed, you know which match was wrong and why.
That difference matters most for the people who sign the lease. A franchisee is betting savings on your forecast. "Locations like this one produced this" is an answer they can test by calling those owners. "Households like these tend to" is not.
The demographic profile
Income, age and education inside a radius, compared with a national ideal customer. A single projected number with no source. Impossible to check after opening.
The comparable-location forecast
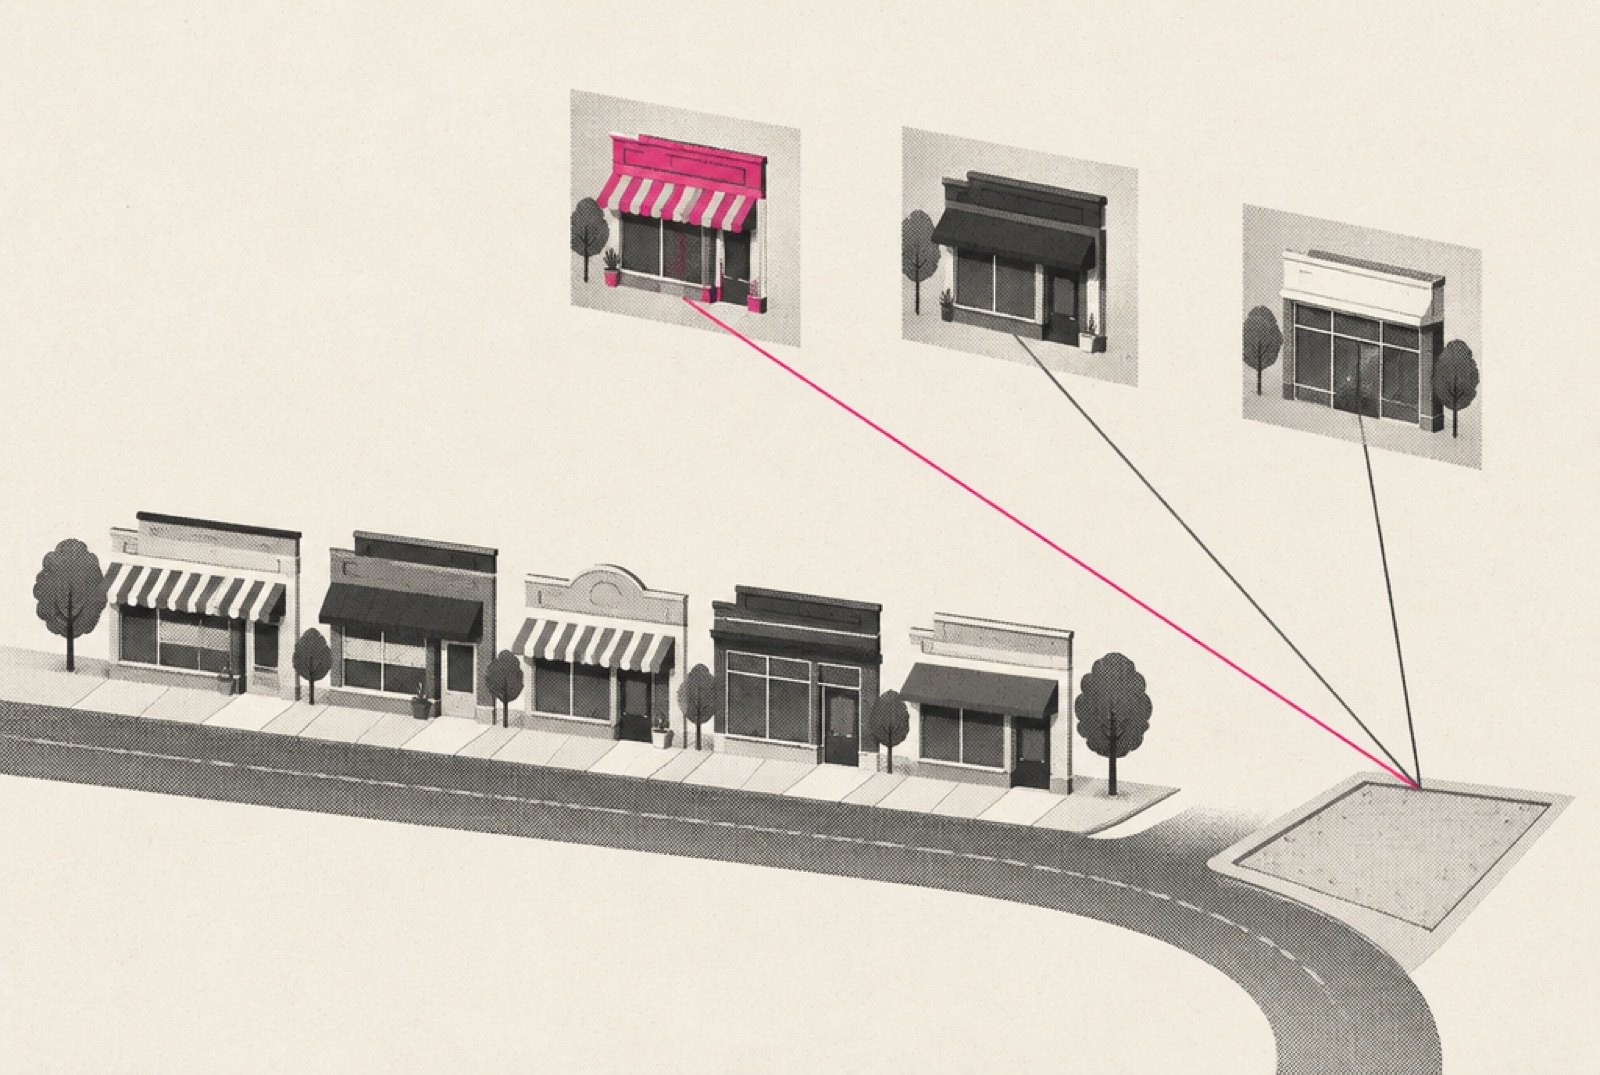
The market around the address, matched against your own open locations. A range from named matches, with a count of how many and a stated confidence. Checked against the real opening.
The playbook: from your locations to a forecast
The work is mostly bookkeeping you should be doing anyway. Here it is in order.
- Write down the market facts for every open location
For each location, record the same handful of facts about the market around it, measured the same way: households inside a real drive time (not a radius), density, and how many direct competitors sit inside that drive per 10,000 households. Use a drive-time trade area, because a circle will overstate some markets and not others. A circle is not a trade area explains why.
- Record what each location actually produced
Pick one or two outcomes you trust and can measure the same way everywhere: enquiries a month and cost per enquiry are the two we forecast. Only use numbers you can trace to a source. A blank is better than a guess, and a missing figure must never be stored as zero.
- Separate mature locations from new ones
A location in its first months is still in its opening curve. Compare a proposed site with locations at a stated age, and say which age you are forecasting.
- Describe the proposed site the same way
Draw the same drive time around the new address and record the same facts. If a fact was measured differently for the new site than for the old ones, the match is broken before it starts.
- Find the closest matches, and weight what matters
Rank your open locations by how close their market facts are to the new site. In our data, density and competition counted for more than income and age, because they describe the auction a location is buying into. Same brand beats same industry when you have both.
- Report a range, the count, and the confidence
Report what the matches produced as a range, name how many matches it came from, and say "low confidence" out loud when nothing is close. A forecast built on one weak match should look different on the page from one built on five strong ones.
A forecast you can trace to real locations can be checked at month six. A profile can only be argued about.
A worked example, with arithmetic only
Say a 20-location fitness system is weighing a new suburban site. Its proposed trade area has moderate density and few direct competitors per 10,000 households.
The team ranks its 20 open, mature locations by how close each market is to the new site. Four are close on density and competition. The rest are either much denser or much more crowded. The four close matches produced, say, 90, 110, 120 and 140 enquiries a month at maturity.
The honest forecast is not "115 enquiries a month". It is "four comparable locations produced between 90 and 140 a month, with two of them between 110 and 120". If only one location had been close, the report should say so and carry a low-confidence label, because one match is an anecdote.
Six months after opening, the new site is producing 70 a month. The team looks back at the four matches and finds that the new location has a large competitor inside its ten-minute drive that none of the four had. That is a lesson the comparable set can absorb: competition inside the drive becomes a stronger part of the match next time. A demographic model would have offered no such lesson. (Every number in this example is hypothetical.)
Presales, and when to refuse a number
A location that has not opened yet raises a special version of the question: how many members will join before the doors open? The same discipline applies with one addition. Do not forecast presales until you have measured enough of them.
Audience refuses to show a presale forecast until at least four presales have been measured. That is a product rule, and it is also a sensible policy for any development team. Until you have four real presale campaigns to compare against, the honest answer to "how many will join before opening" is "we have not measured enough to say". The same refusal belongs anywhere the comparable set is thin: a new state, a new format, a first location in a dense city when every open location is suburban.
What to measure, and what to do this quarter
The comparable set only earns trust if you check it. Three measures keep it honest:
- Forecast against actual, by month six. For every site opened on a comparable forecast, record the forecast range and where the real number landed. Above, inside or below.
- Match count per forecast. How many comparable locations stood behind each forecast. If most forecasts rest on one or two matches, the set is too small or too uniform.
- Missing facts. How many open locations are missing a market fact or an outcome. Every gap shrinks the set.
Our own comparable set is about 37 locations. Audience's public page reported 3,860 enquiries measured in the 90 days to October 10, 2026, across 31 open locations in the forecast. Those figures will drift, which is the point: the set is refreshed on a schedule so the matches reflect what locations are doing now, not when they were added.
The quarter's work is small. Pick your mature locations, record the same market facts for each, attach one or two outcomes you trust, and run your next proposed site against them before anyone mentions median income. If you want that done from an address, with the matches named and the confidence stated, that is what Audience was built for.